

If you handed me $1 million and I set fire to $800,000 of it while you watched, you wouldn’t need a dashboard to tell you something had gone wrong.
I use that picture with clients whose campaigns return a fraction of their spend, because it turns a ratio into cash, which is how a CFO already sees it. One retail account, before we took over, was regularly spending $15,000 a month on ads to bring in no more than $4,000 a month in revenue. Nobody there framed the $11,000 gap per month as money being burned, yet that’s exactly what was happening.
When marketers want a CFO’s support, they usually go looking for better ROI metrics. What wins the CFO over is evidence that starts from what a customer is worth to the business, what the cost is to acquire them, how long it takes, and what is involved over time to win one. Every other number on a marketing report, from impressions, clicks, conversions, ROAS, MER, earns its place only by showing whether the business is moving toward that outcome.
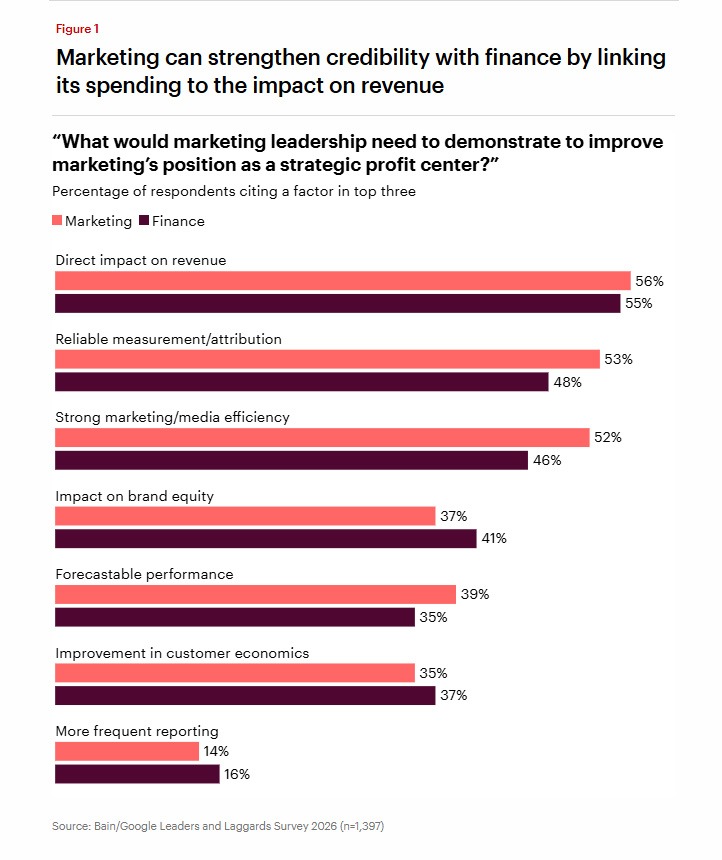
Both sides already agree on that scoreboard. When Bain and Google surveyed 1,397 senior marketing and finance executives this year, direct revenue impact topped the list for strengthening marketing’s standing with finance, cited by 56% of marketers and 55% of finance leaders.
Start with what a customer is worth
A CFO already understands the value of a customer, so start with what a customer costs to acquire and what they spend over the relationship, e.g., CLV (Customer Lifetime Value) or ACV (Annual Customer Value or Annual Contract Value). Automated ROAS (Return on Ad Spend) can’t answer that alone because it only reports the first purchase. In ecommerce, we also look at the Marketing Efficiency Ratio (MER), which divides total revenue by total marketing spend, because the goal is to win a customer once and keep them buying through the cheapest channels you have.
Sometimes that arithmetic shows a product can’t carry the cost of finding a buyer. An artisan chocolate maker came to us with a margin per bar too thin to absorb what any platform charges to acquire a purchase, so no campaign could ever show a positive ROAS. Before spending anything, we had to rethink the offer itself, with bundles and gift baskets that could lift order value to ensure even first customer acquisition could move into positive ROAS and, with ongoing nurture, profitable ongoing returns.
Build every target from margin
Once you know what a customer is worth, a single ROAS target for the whole business stops making sense. At an ethical retail brand we work with, one product turns a healthy profit at 3x while the rest need about 5.5x before they earn anything. Blend them into one number, and the account looks weaker than it is, which is how a profitable product ends up cut by someone reading the wrong figure. When we showed the founder the two reported separately, she told us we were thinking about her business in ways she hadn’t previously.
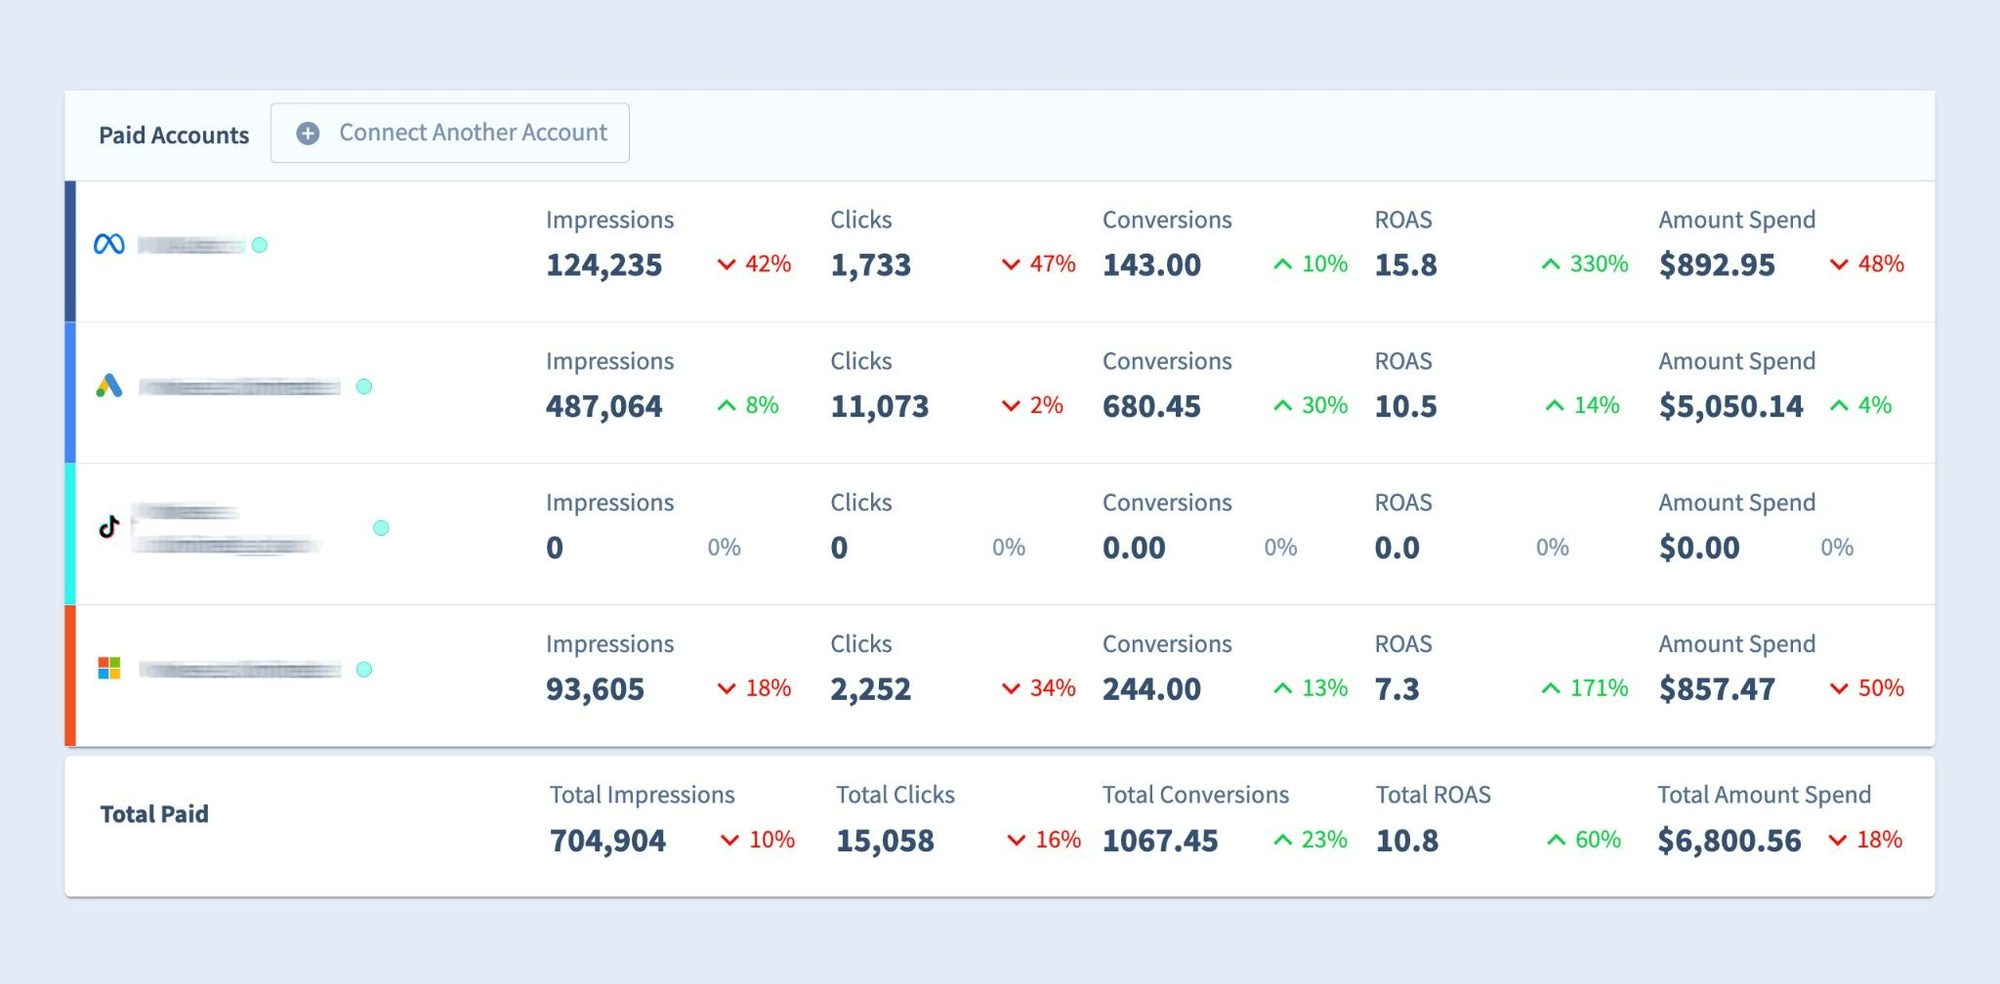
A multi-store retailer once asked us what ROAS it should target across all its businesses. On a minimum advertised $20 product where it owns the IP, it keeps about $17, while a $20 resold item from a third party leaves it about $3. A target built from each product’s margin and ease of visualizing the CPA at the product level is one a CFO (and each business owner) can check against their own books.
Prove that reach leads somewhere
Impressions, clicks, traffic, and users on site can sit on a CFO’s dashboard once you show they’re leading indicators of revenue for that specific business.
Reach counts when the right decision-maker at the right organization engages and then acts. If they download a guide under their own name and nobody from sales follows up, the metric looks healthy while the revenue never arrives, even though the lead did its job.
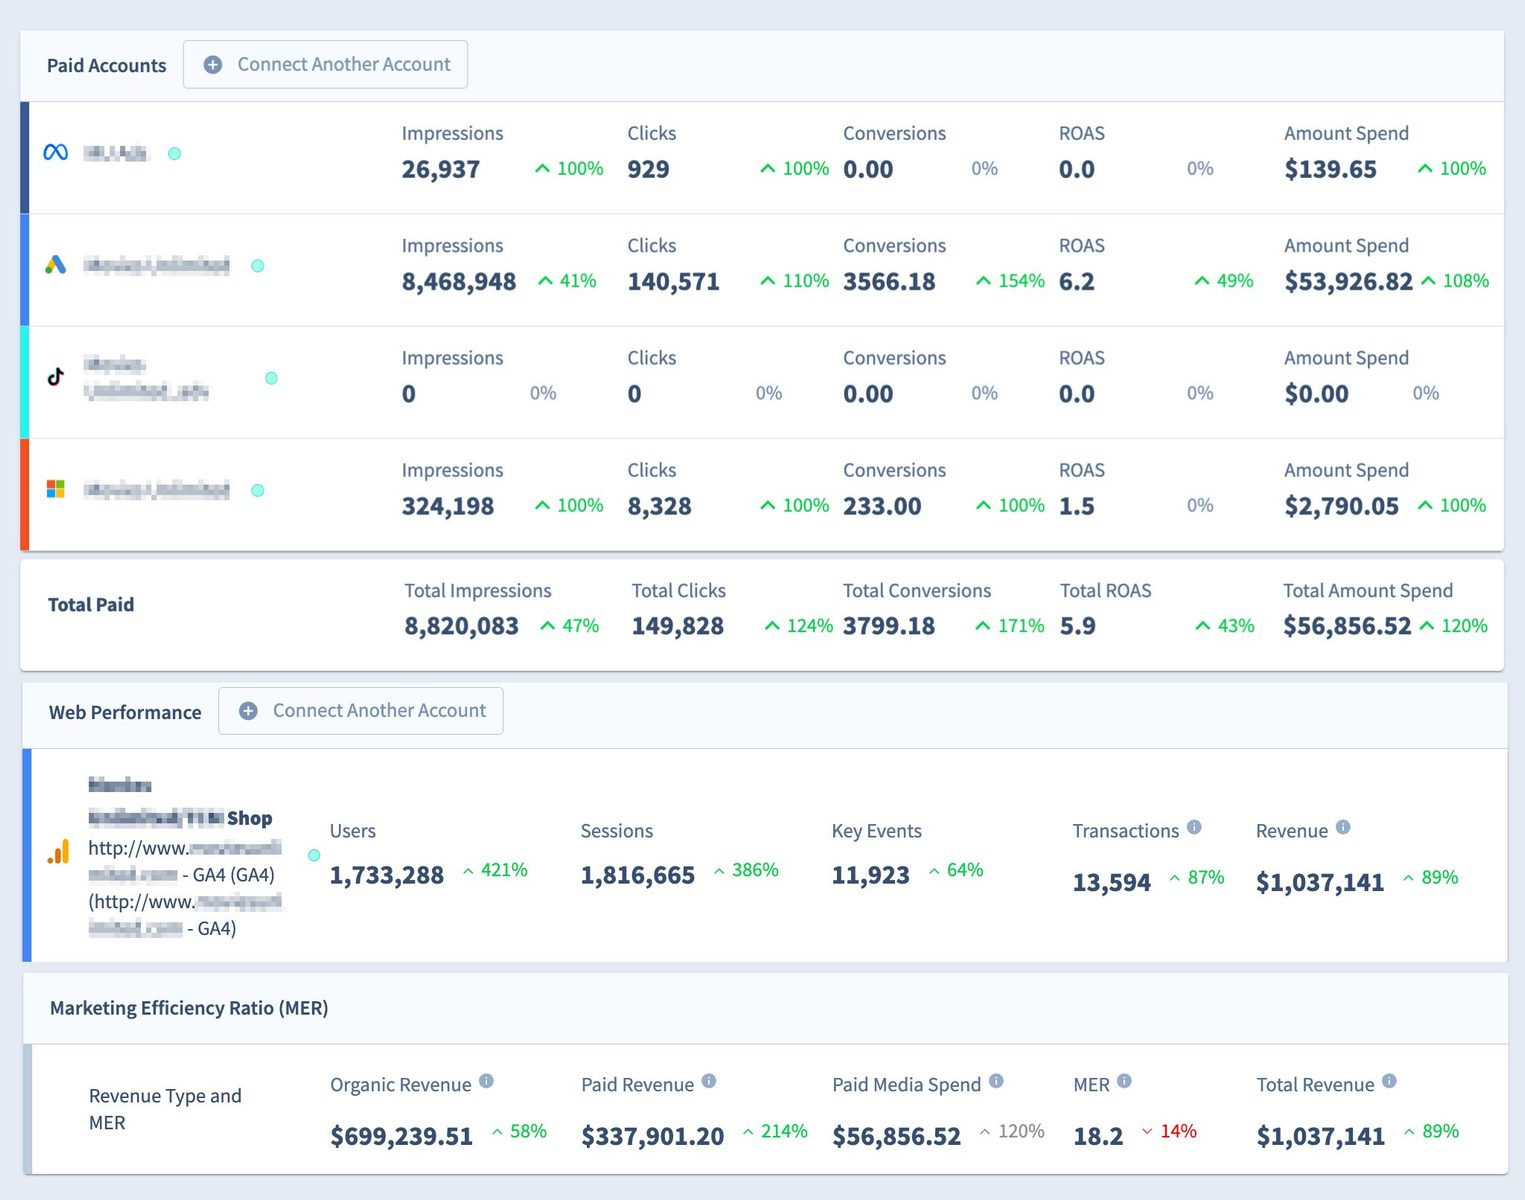
Growth figures need the same discipline.
Show a CFO a triple-digit jump and the first response will be “up from what?”, because percentage growth over a small base tells finance nothing.
Every metric on a digital marketing report should survive one question. If this number moves, what does it impact, and what will we do differently (keep doing, stop doing, do more of)?
Let the sales cycle set the clock
Most of my examples so far come from ecommerce, where a sale can follow an ad within days. B2B buyers can take anywhere from six to 18 months to sign, and a minimum of 14 touchpoints, so while marketing adds qualified buyers to that cycle and can increase quality pipeline, the time it takes to convert relies on proven sales and customer conversion programs.
If a company typically takes nine months from first lead to signed contract, no revenue figure can be read honestly before month nine, and inside that window the measures that count are qualified leads reaching sales and the pipeline value they carry.
Bain and Google found the strongest marketing and finance partnerships agree on those indicators and their time horizon before a campaign launches. Digivizer holds every engagement to a minimum six-month minimum for the same reason.
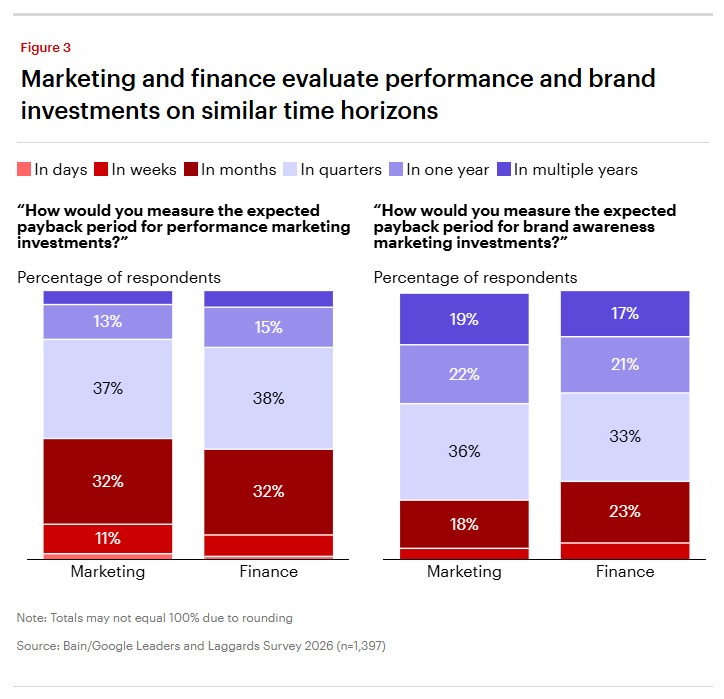
Time also exposes the usual defense of a losing campaign, which is that it’s building the brand. Brand investment does compound, so organic and paid returns should climb as the months pass; when they stay flat, the money is burning. On that retail account I mentioned earlier, we cut spend and refused to scale until the fundamentals were right, and revenue is now scaling up to ensure sustainable profitability.
When the marketing budget comes under threat
When a global head office orders a regional marketing budget cut, effective programs get switched off alongside the waste. Stopping marketing is like letting go of a basketball you’ve been dribbling: the first bounce still reaches your hand, but each one after comes up lower, and getting the ball back to height takes far longer than the savings suggest.
A marketer who has reported in the CFO’s language all year can show leading indicators softening weeks before revenue follows, and that evidence is what keeps a working program funded when the pressure arrives.
The arithmetic that exposed $800,000 going up in smoke is the same arithmetic that saves a program that’s working, because a CFO who has trusted your numbers all year will believe you when a cut is about to cost more than it saves and when it is time to scale profitably.